Factorial ANOVA

Two-factor
| Low N | Medium N | High N | |
|---|---|---|---|
Low temp. |
XXX |
XXX |
XXX |
High temp |
XXX |
XXX |
XXX |
\[ y_{ijk} = \mu + \alpha_i + \beta_j + \alpha_i\beta_j + \varepsilon_{ijk}\\ \]
Two-factor
| Low N | Medium N | High N | |
|---|---|---|---|
Low temp. |
XXX (\(\eta=\mu\)) |
XXX (\(\eta=\mu - \beta_2\)) |
XXX (\(\eta=\mu - \beta_3\)) |
High temp |
XXX (\(\eta=\mu - \alpha_2\)) |
XXX (\(\eta=\mu - \alpha_2 - \beta_2 - \gamma_{2,2}\)) |
XXX (\(\eta=\mu - \alpha_2 - \beta_3 - \gamma_{2,3}\)) |
\[ \begin{align} y_{ijk} &\sim{} N(\eta_{ijk}, \sigma^2)\\ \eta_{ijk} &= \mu + \sum_{j=2}^J \alpha_j \textbf{T}_j + \sum_{k=2}^K \beta_k \textbf{N}_k \\ &+ \sum_{j=2,k=2}^{J\times K} \gamma_{jk} \textbf{TN}_{jk} \end{align} \]
Two-factor
| Low N | Medium N | High N | |
|---|---|---|---|
Low temp. |
XXX |
XXX |
XXX |
High temp |
XXX |
XXX |
XXX |
 Temp   Nitrogen
------ ----------
 Low      Low
 Low      Low
 Low      Low
 Low     Medium
 Low     Medium
 Low     Medium
 Low      High
 Low      High
 Low      High
 High     Low
 High     Low
 High     Low
 High    Medium
 High    Medium
 High    Medium
 High     High
 High     High
High High Two-factor
| Low N | Medium N | High N | |
|---|---|---|---|
Low temp. |
Low (\(\eta=\alpha\)) |
Low (\(\eta=\alpha - \beta_3\)) |
(\(\eta=\alpha - \beta_4\)) |
High temp |
Low (\(\eta=\alpha - \beta_2\)) |
Low (\(\eta=\alpha - \beta_2 - \beta_3 - \beta_5\)) |
(\(\eta=\alpha - \beta_2 - \beta_4 - \beta_6\)) |
\[ y_{ij} \sim{} N(\eta_{ij}, \color{darkorange}{\sigma^2})\\ \eta_{ij} = \color{darkorange}{\alpha} + \color{darkorange}{\mathbf{\beta}} X \]
\[ \begin{align} \color{darkorange}{\alpha} &\sim{} N(0,1000)\\ \color{darkorange}{\beta_j} &\sim{} N(0,1000)\\ \color{darkorange}{\sigma^2} &\sim{} cauchy(0,4)\\ \end{align} \]
| Format of starling.csv data files | |||||||||||||||||||||||||||||||||||||||||||||||||||||
|---|---|---|---|---|---|---|---|---|---|---|---|---|---|---|---|---|---|---|---|---|---|---|---|---|---|---|---|---|---|---|---|---|---|---|---|---|---|---|---|---|---|---|---|---|---|---|---|---|---|---|---|---|---|
|
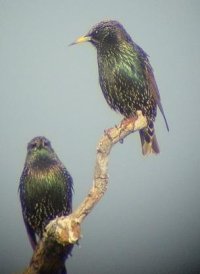
|
||||||||||||||||||||||||||||||||||||||||||||||||||||
> starling <- read.csv('../data/starling.csv',strip.white=T)Error in file(file, "rt"): cannot open the connection> head(starling)Error in head(starling): object 'starling' not found| Format of quinn.csv data files | ||||||||||||||||||||||||||||||||||||||||||||||||||||||||||||||||||
|---|---|---|---|---|---|---|---|---|---|---|---|---|---|---|---|---|---|---|---|---|---|---|---|---|---|---|---|---|---|---|---|---|---|---|---|---|---|---|---|---|---|---|---|---|---|---|---|---|---|---|---|---|---|---|---|---|---|---|---|---|---|---|---|---|---|---|
|
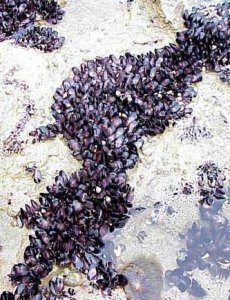
|
Error in file(file, "rt"): cannot open the connectionError in head(quinn): object 'quinn' not found