Tutorial 12.13 - Spatial and spatio-temporal models with INLA
23 Oct 2017
Overview
Introduce what spatial and spatio-temporal models are.. Include point reference data...
Simulating spatial data
We can simulate spatial data if we assume that the data can be drawn from a spatial field in which observations have some sort of spatial dependency. Observations closer together in space are likely to be more similar to one another. That is the similarity between locations is a function of the distance between the locations.
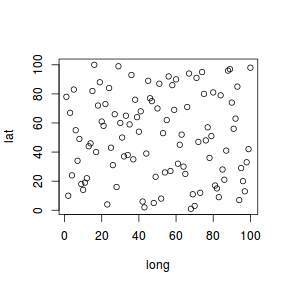
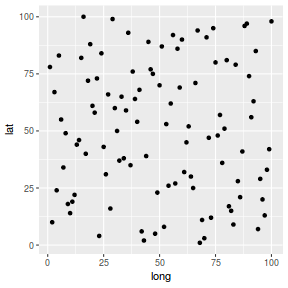
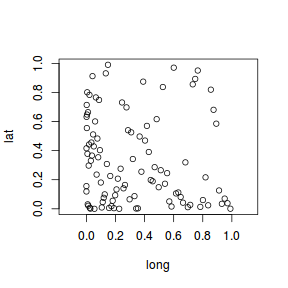
Lets start by generating 200 locations (quadrats, sites, etc) within a square domain. We will generate the coordinates of the locations such that the points are randomly scattered throughout the domain, however, we could alternatively sample in a way that yields a higher density of points in a particular region. Furthermore, rather than assume a perfectly square domain, we could sample from a polygon...
        ## generate points from a simple square domain
        set.seed(1)
        n <- 100
        coords <- cbind(long=sample(1:n), lat=sample(1:n))
        plot(coords)
        coords.df <- data.frame(coords)
        library(ggplot2)
        ggplot(coords.df, aes(y=lat, x=long)) + geom_point()
set.seed(123)
n <- 100
coords1 <- cbind(long = sample(1:n/n - 0.5/n)^2, lat = sample(1:n/n - 0.5/n)^2)
plot(coords1, asp = 1)
set.seed(1)
library(sp)
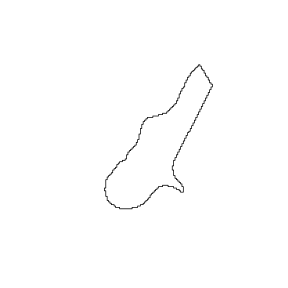
## Create a spatialpolygons object - lets make use of the meuse.area matrix in the
## sp package
data(meuse.area)
meuse.sp <- SpatialPolygons(list(Polygons(list(Polygon(meuse.area)), "x")))
plot(meuse.sp)
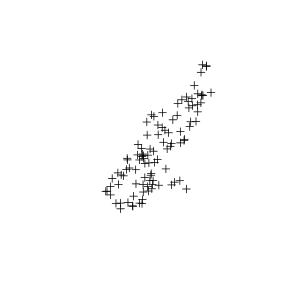
coords.sp <- spsample(meuse.sp, n = 100, type = "random")
plot(coords.sp)
The spatial dependency between points ($s_i$ and $s_j$) could be defined by a Matern covariance structure. A Matern correlation function is: $$ Cor_M(X(s_i), X(s_j)) = \frac{2^{1-\nu}}{\Gamma(\nu)}(\kappa\parallel s_i - s_j\parallel)^\nu K_\nu(\kappa\parallel s_i - s_j\parallel) $$ where $\parallel s_i - s_j\parallel$ is the euclidean distance between two points, $K_\nu$ is the modified Bessel function of the second order, $\kappa$ (kappa) is the scale parameter and $\nu$ (nu) is the smoothness parameter. The Matern covariance function is thus: $$ \Sigma_{i,j}=\sigma_x Cor_M(X(s_i), X(s_j)) $$ where $\sigma_x$ is the marginal variance of the process. This defines the process of contamination between points over the spatial domain. Therefore, the relative value of any point within this domain can be generated from a multivariate normal distribution with a mean of 0 and a variance of $\Sigma$.
kappa <- 7
nu <- 1
dmat <- dist(coords)
cor_m <- as.matrix((2^(1 - nu)/gamma(nu)) * ((kappa * dmat)^nu) * (besselK(dmat *
    kappa, nu)))
cor_m[1:5, 1:5]
              1             2             3             4             5
1  0.000000e+00  1.794100e-98 6.094506e-149 5.129406e-210  6.902439e-26
2  1.794100e-98  0.000000e+00  5.051134e-65 2.978713e-245  6.755479e-94
3 6.094506e-149  5.051134e-65  0.000000e+00 3.006513e-233 4.077963e-152
4 5.129406e-210 2.978713e-245 3.006513e-233  0.000000e+00 7.386427e-236
5  6.902439e-26  6.755479e-94 4.077963e-152 7.386427e-236  0.000000e+00
In generating observed responses at the locations, it becomes realistic to add additional stochasticity due to measurement error. So that the value of the observed response at locations $s_i$ is equal to the realization of the underlying spatial field (process) at that location ($x(s_i)$) plus some additional measurement error ($e_i$) that we assume to be independent and normally distributed: $$ y(s_i) = x(s_i) + e_i \hspace{1cm} e_i \sim{}N(0, \sigma^2_e) $$ where $\sigma^2_e$ is the 'nugget' effect. Thus the marginal distribution of the observed data ($y(s)$) is: $\sigma^2_eI + \Sigma$
beta0 <- 10
sigma2e <- 0.3
sigma2x <- 5

diag(cor_m) <- 1
cov_m <- sigma2e * diag(n) + sigma2x * cor_m

L <- chol(cov_m)
set.seed(234)
y <- beta0 + drop(rnorm(n) %*% L)

coords.df <- data.frame(coords.df, y = y)
head(coords)
     long lat
[1,]   27  66
[2,]   37  35
[3,]   57  27
[4,]   89  97
[5,]   20  61
[6,]   86  21
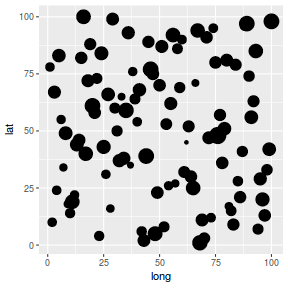
library(ggplot2)
ggplot(coords.df, aes(y = lat, x = long)) + geom_point(size = y/2)
SPDE
Give an intro to stochastic partial differential equations (SPDE) and the computational advantages.
Mesh
Convex hull based meshes
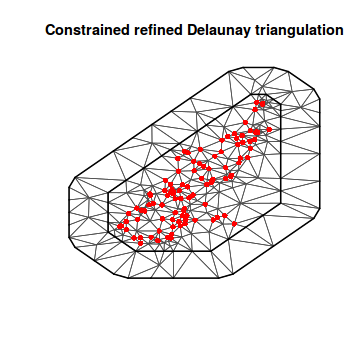
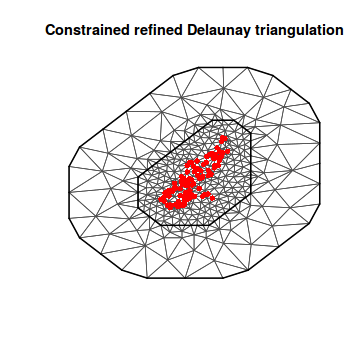
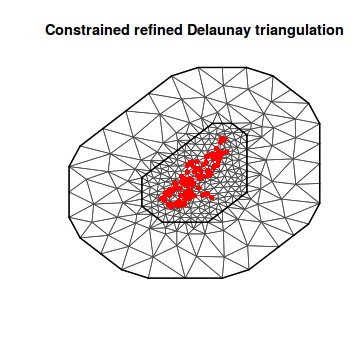
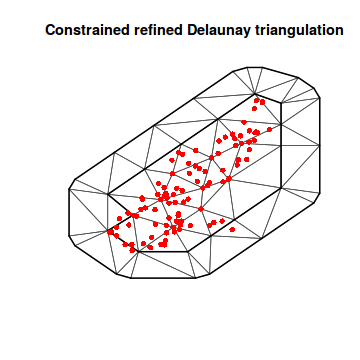
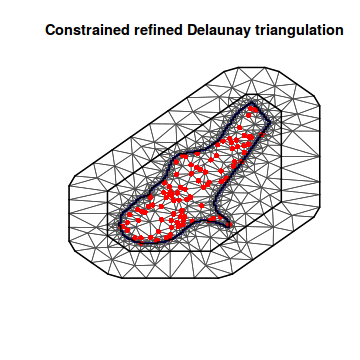
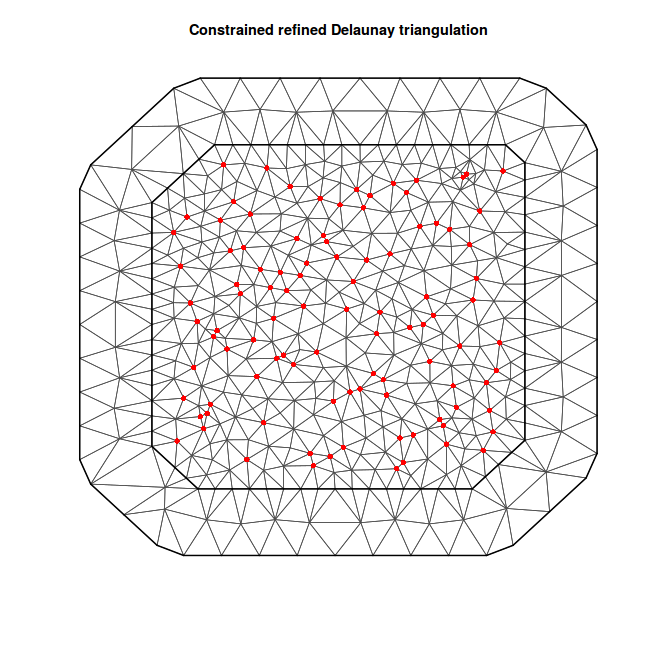
The inla.mesh.2d() function can be used to generate a Constrained Refined Delaunay Triangulation (CRDT). To demonstrate the various mesh generation options, we will generate a number of meshes. As there are potentially more options relevant to spatial points within an irregular polygon domain rather than a perfectly square domain, I will first demonstrate meshes for the coords.sp coordinates based on points sampled from the meuse.area object earlier.
The function must be supplied with either the coordinates of locations or else the location domain (coordinates of a hull around all the points) in which to generate the triangles. In addition, we must indicate the minimum length of triangle edges. In doing so, we indirectly dictate the granularity with which the domain is broken up into triangles (the smaller the edges, the smaller the triangles, and thus the more of them).
As the variance properties of triangles around the edge are half that of triangles within the interior, it is a good idea to define an outer edge as a buffer.
| Argument | Description |
|---|---|
| loc | a matrix of coordinates used as initial triangulation nodes |
| loc.domain | coordinates of a polygon that defines the spatial domain |
| max.edge | maximum permissible triangle edge length for the inner (and outer) region. The value(s) should be on a scale relevant to the magnitude of the coordinates. The lower the values, the more triangles. |
| offset | an amount to expand the distance between the points and the edge of the inner (and outer) region. Positive values are treated as absolute distances and negative numbers are treated as multipliers. |
| cuttoff | the minimum distance allowed between points. This allows points that are very close together to be placed in the same triangle. Of particular concern, is that we don't want triangles with very sharp angles as these will be less effective when it comes to projections. |
library(INLA)
## Convert spatialpolygon object into matrix
coords.sp <- as.matrix(as.data.frame(coords.sp))
mesh1 <- inla.mesh.2d(loc = coords.sp, max.edge = c(2000, 2000))
plot(mesh1)
points(coords.sp, col = "red", pch = 16)
mesh2 <- inla.mesh.2d(loc = coords.sp, max.edge = c(500, 2000))
plot(mesh2)
points(coords.sp, col = "red", pch = 16)
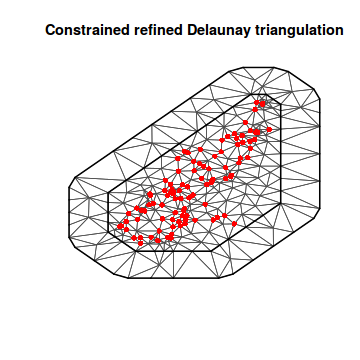
mesh3 <- inla.mesh.2d(loc = coords.sp, max.edge = c(500, 2000), offset = c(1000,
    3000))
plot(mesh3)
points(coords.sp, col = "red", pch = 16)
mesh4 <- inla.mesh.2d(loc = coords.sp, max.edge = c(500, 2000), offset = c(-0.2,
    -0.5))
plot(mesh4)
points(coords.sp, col = "red", pch = 16)
mesh5 <- inla.mesh.2d(loc = coords.sp, max.edge = c(2000, 2000), cutoff = 500)
plot(mesh5)
points(coords.sp, col = "red", pch = 16)
mesh6 <- inla.mesh.2d(loc = coords.sp, max.edge = c(500, 2000), boundary = list(inla.mesh.segment(meuse.area)))
plot(mesh6)
points(coords.sp, col = "red", pch = 16)
lines(meuse.area, lwd = 2)
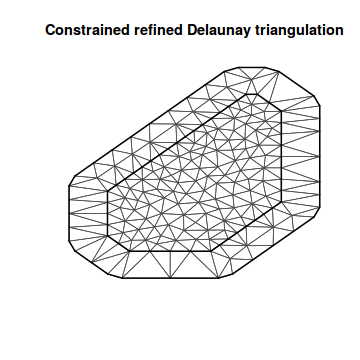
## or if we just have a matrix of coordinates around the spatial domain
mesh7 <- inla.mesh.2d(loc.domain = meuse.area, max.edge = c(500, 2000))
plot(mesh7)
Non-convex hull meshes
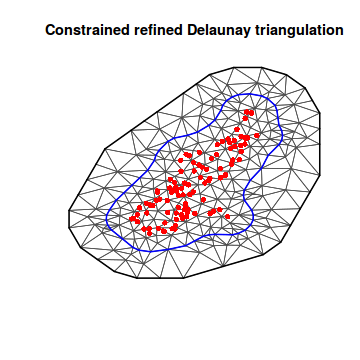
Alternatively, we can base the domain on a non-convex hull by using the inla.nonconvex.hull() function.
library(INLA)
## Convert spatialpolygon object into matrix
coords.sp <- as.matrix(as.data.frame(coords.sp))
boundary <- inla.nonconvex.hull(points = coords.sp)
mesh8 <- inla.mesh.2d(boundary = boundary, max.edge = c(500, 2000))
plot(mesh8)
points(coords.sp, col = "red", pch = 16)
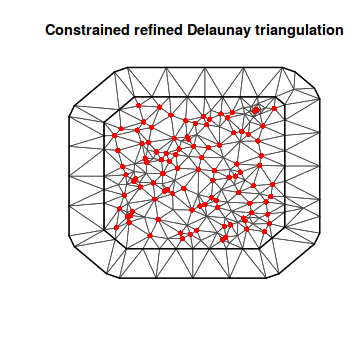
Returning to our square domain, we want to establish a mesh that has a decent buffer (outer edge)
mesh <- inla.mesh.2d(coords, max.edge = c(20, 40))
plot(mesh)
points(coords, col = "red", pch = 16)
This mesh is a list containing:
str(mesh)
List of 8
 $ meta    :List of 5
  ..$ call        : language inla.mesh.create(loc = rbind(loc, mesh2$loc), boundary = boundary[[2]],      interior = c(boundary2, interior2), extend = list(n = n[2], offset = offset[2]),  ...
  ..$ fmesher.args: chr "--input=input.s --cutoff=1e-12  --interior=input.segm.int.idx  --interiorgrp=input.segm.int.grp --cet=16,-0.15 --rcdt=21,40,40 "| __truncated__
  ..$ time        : num [1:5, 1:5] 0 0 0 0 0 0 0 0 0 0 ...
  .. ..- attr(*, "dimnames")=List of 2
  .. .. ..$ : chr [1:5] "pre" "fmesher" "post" "object" ...
  .. .. ..$ : NULL
  ..$ prefix      : chr "/tmp/RtmpnLy1Nt/fmesher3e541a5fea57."
  ..$ is.refined  : logi TRUE
 $ manifold: chr "R2"
 $ n       : int 223
 $ loc     : num [1:223, 1:3] 8.28 90.72 106.58 106.58 100.72 ...
 $ graph   :List of 5
  ..$ tv : int [1:415, 1:3] 29 127 73 64 200 26 50 49 12 23 ...
  ..$ vt : int [1:223, 1] 12 21 36 414 53 7 10 85 11 35 ...
  ..$ tt : int [1:415, 1:3] 26 212 161 91 53 372 69 113 65 111 ...
  ..$ tti: int [1:415, 1:3] 1 3 1 3 1 1 2 1 2 2 ...
  ..$ vv :Formal class 'dgTMatrix' [package "Matrix"] with 6 slots
  .. .. ..@ i       : int [1:1274] 26 37 61 95 192 207 20 30 55 127 ...
  .. .. ..@ j       : int [1:1274] 0 0 0 0 0 0 1 1 1 1 ...
  .. .. ..@ Dim     : int [1:2] 223 223
  .. .. ..@ Dimnames:List of 2
  .. .. .. ..$ : NULL
  .. .. .. ..$ : NULL
  .. .. ..@ x       : num [1:1274] 1 1 1 1 1 1 1 1 1 1 ...
  .. .. ..@ factors : list()
 $ segm    :List of 2
  ..$ bnd:List of 5
  .. ..$ loc   : NULL
  .. ..$ idx   : int [1:29, 1:2] 193 218 211 217 194 195 196 197 221 213 ...
  .. ..$ grp   : int [1:29, 1] 0 0 0 0 0 0 0 0 0 0 ...
  .. ..$ is.bnd: logi TRUE
  .. ..$ crs   : NULL
  .. ..- attr(*, "class")= chr "inla.mesh.segment"
  ..$ int:List of 5
  .. ..$ loc   : NULL
  .. ..$ idx   : int [1:38, 1:2] 1 38 17 25 9 33 14 31 2 21 ...
  .. ..$ grp   : int [1:38, 1] 0 0 0 0 0 0 0 0 0 0 ...
  .. ..$ is.bnd: logi FALSE
  .. ..$ crs   : NULL
  .. ..- attr(*, "class")= chr "inla.mesh.segment"
 $ idx     :List of 2
  ..$ loc    : int [1:100] 39 40 41 42 43 44 45 46 47 48 ...
  ..$ lattice: NULL
 $ crs     : NULL
 - attr(*, "class")= chr "inla.mesh"
## The number of vertices in the mesh
mesh$n
[1] 223
## The indices of the vertices that correspond to the coordinates of the observed
## locations
mesh$idx$loc
  [1]  39  40  41  42  43  44  45  46  47  48  49  50  51  52  53  54  55  56
 [19]  57  58  59  60  61  62  63  64  65  66  67  68  69  70  71  72  73  74
 [37]  75  76  77  78  79  80  81  82  83  84  85  86  87  88  89  90  91  92
 [55]  93  94  95  96  97  98  99 100 101 102 103 104 105 106 107 108 109 110
 [73] 111 112 113 114 115 116 117 118 119 120 121 122 123 124 125 126 127 128
 [91] 129 130 131 132 133 134 135 136 137 138
SPDE model
spde <- inla.spde2.matern(mesh, alpha = 2)
str(spde)
List of 7
 $ model     : chr "matern"
 $ n.spde    : int 223
 $ n.theta   : int 2
 $ param.inla:List of 15
  ..$ n            : int 223
  ..$ n.theta      : int 2
  ..$ M0           :Formal class 'dgTMatrix' [package "Matrix"] with 6 slots
  .. .. ..@ i       : int [1:223] 0 1 2 3 4 5 6 7 8 9 ...
  .. .. ..@ j       : int [1:223] 0 1 2 3 4 5 6 7 8 9 ...
  .. .. ..@ Dim     : int [1:2] 223 223
  .. .. ..@ Dimnames:List of 2
  .. .. .. ..$ : NULL
  .. .. .. ..$ : NULL
  .. .. ..@ x       : num [1:223] 190 171 208 117 129 ...
  .. .. ..@ factors : list()
  ..$ M1           :Formal class 'dgTMatrix' [package "Matrix"] with 6 slots
  .. .. ..@ i       : int [1:1497] 0 26 37 61 95 192 207 1 20 30 ...
  .. .. ..@ j       : int [1:1497] 0 0 0 0 0 0 0 1 1 1 ...
  .. .. ..@ Dim     : int [1:2] 223 223
  .. .. ..@ Dimnames:List of 2
  .. .. .. ..$ : NULL
  .. .. .. ..$ : NULL
  .. .. ..@ x       : num [1:1497] 5.1604 -2.1409 -1.9881 -0.0821 -0.0883 ...
  .. .. ..@ factors : list()
  ..$ M2           :Formal class 'dgTMatrix' [package "Matrix"] with 6 slots
  .. .. ..@ i       : int [1:4041] 0 7 16 26 37 61 65 84 95 108 ...
  .. .. ..@ j       : int [1:4041] 0 0 0 0 0 0 0 0 0 0 ...
  .. .. ..@ Dim     : int [1:2] 223 223
  .. .. ..@ Dimnames:List of 2
  .. .. .. ..$ : NULL
  .. .. .. ..$ : NULL
  .. .. ..@ x       : num [1:4041] 0.1841 0.0137 0.0143 -0.1095 -0.1042 ...
  .. .. ..@ factors : list()
  ..$ B0           : num [1:223, 1:3] 0 0 0 0 0 0 0 0 0 0 ...
  ..$ B1           : num [1:223, 1:3] 0 0 0 0 0 0 0 0 0 0 ...
  ..$ B2           : num [1:223, 1:3] 1 1 1 1 1 1 1 1 1 1 ...
  .. ..- attr(*, "dimnames")=List of 2
  .. .. ..$ : NULL
  .. .. ..$ : chr [1:3] "B" "" ""
  ..$ BLC          : num [1:6, 1:3] 0 0 0 0 -2.53 ...
  .. ..- attr(*, "dimnames")=List of 2
  .. .. ..$ : chr [1:6] "theta.1" "theta.2" "tau.1" "kappa.1" ...
  .. .. ..$ : NULL
  ..$ theta.mu     : num [1:2] 1.13 -2.4
  ..$ theta.Q      : num [1:2, 1:2] 0.1 0 0 0.1
  ..$ transform    : chr "identity"
  ..$ theta.initial: num [1:2] 1.13 -2.4
  ..$ fixed        : logi [1:2] FALSE FALSE
  ..$ theta.fixed  : num(0)
 $ f         :List of 4
  ..$ model          : chr "spde2"
  ..$ n              : int 223
  ..$ spde2.transform: chr "identity"
  ..$ hyper.default  :List of 2
  .. ..$ theta1:List of 3
  .. .. ..$ prior  : chr "mvnorm"
  .. .. ..$ param  : num [1:6] 1.13 -2.4 0.1 0 0 ...
  .. .. ..$ initial: num 1.13
  .. ..$ theta2:List of 1
  .. .. ..$ initial: num -2.4
 $ BLC       : num [1:6, 1:3] 0 0 0 0 -2.53 ...
  ..- attr(*, "dimnames")=List of 2
  .. ..$ : chr [1:6] "theta.1" "theta.2" "tau.1" "kappa.1" ...
  .. ..$ : NULL
 $ mesh      :List of 8
  ..$ meta    :List of 5
  .. ..$ call        : language inla.mesh.create(loc = rbind(loc, mesh2$loc), boundary = boundary[[2]],      interior = c(boundary2, interior2), extend = list(n = n[2], offset = offset[2]),  ...
  .. ..$ fmesher.args: chr "--input=input.s --cutoff=1e-12  --interior=input.segm.int.idx  --interiorgrp=input.segm.int.grp --cet=16,-0.15 --rcdt=21,40,40 "| __truncated__
  .. ..$ time        : num [1:5, 1:5] 0 0 0 0 0 0 0 0 0 0 ...
  .. .. ..- attr(*, "dimnames")=List of 2
  .. .. .. ..$ : chr [1:5] "pre" "fmesher" "post" "object" ...
  .. .. .. ..$ : NULL
  .. ..$ prefix      : chr "/tmp/RtmpnLy1Nt/fmesher3e541a5fea57."
  .. ..$ is.refined  : logi TRUE
  ..$ manifold: chr "R2"
  ..$ n       : int 223
  ..$ loc     : num [1:223, 1:3] 8.28 90.72 106.58 106.58 100.72 ...
  ..$ graph   :List of 5
  .. ..$ tv : int [1:415, 1:3] 29 127 73 64 200 26 50 49 12 23 ...
  .. ..$ vt : int [1:223, 1] 12 21 36 414 53 7 10 85 11 35 ...
  .. ..$ tt : int [1:415, 1:3] 26 212 161 91 53 372 69 113 65 111 ...
  .. ..$ tti: int [1:415, 1:3] 1 3 1 3 1 1 2 1 2 2 ...
  .. ..$ vv :Formal class 'dgTMatrix' [package "Matrix"] with 6 slots
  .. .. .. ..@ i       : int [1:1274] 26 37 61 95 192 207 20 30 55 127 ...
  .. .. .. ..@ j       : int [1:1274] 0 0 0 0 0 0 1 1 1 1 ...
  .. .. .. ..@ Dim     : int [1:2] 223 223
  .. .. .. ..@ Dimnames:List of 2
  .. .. .. .. ..$ : NULL
  .. .. .. .. ..$ : NULL
  .. .. .. ..@ x       : num [1:1274] 1 1 1 1 1 1 1 1 1 1 ...
  .. .. .. ..@ factors : list()
  ..$ segm    :List of 2
  .. ..$ bnd:List of 5
  .. .. ..$ loc   : NULL
  .. .. ..$ idx   : int [1:29, 1:2] 193 218 211 217 194 195 196 197 221 213 ...
  .. .. ..$ grp   : int [1:29, 1] 0 0 0 0 0 0 0 0 0 0 ...
  .. .. ..$ is.bnd: logi TRUE
  .. .. ..$ crs   : NULL
  .. .. ..- attr(*, "class")= chr "inla.mesh.segment"
  .. ..$ int:List of 5
  .. .. ..$ loc   : NULL
  .. .. ..$ idx   : int [1:38, 1:2] 1 38 17 25 9 33 14 31 2 21 ...
  .. .. ..$ grp   : int [1:38, 1] 0 0 0 0 0 0 0 0 0 0 ...
  .. .. ..$ is.bnd: logi FALSE
  .. .. ..$ crs   : NULL
  .. .. ..- attr(*, "class")= chr "inla.mesh.segment"
  ..$ idx     :List of 2
  .. ..$ loc    : int [1:100] 39 40 41 42 43 44 45 46 47 48 ...
  .. ..$ lattice: NULL
  ..$ crs     : NULL
  ..- attr(*, "class")= chr "inla.mesh"
 - attr(*, "class")= chr [1:3] "inla.spde2" "inla.spde" "inla.model.class"
The SPDE model can get quite complex. So to assist with keeping track of which elements relate to what effects, we can create an index.
s.index <- inla.spde.make.index("spatial.field", n.spde = spde$n.spde)
str(s.index)
List of 3
 $ spatial.field      : int [1:223] 1 2 3 4 5 6 7 8 9 10 ...
 $ spatial.field.group: int [1:223] 1 1 1 1 1 1 1 1 1 1 ...
 $ spatial.field.repl : int [1:223] 1 1 1 1 1 1 1 1 1 1 ...
The vector called spatial.field, contains the indices for the spatial field. In this case, our spatial data are all in the one group.
The projector matrix
The SPDE model is defined on a mesh with $m$ dimensions, whereas the response is defined at $n$ locations. We need a way to link the $m$ mesh vertices to the $n$ responses. This is achieved via a projector matrix ($\mathbf{A}$). This projector matrix is build using the inla.spde.make.A() function.
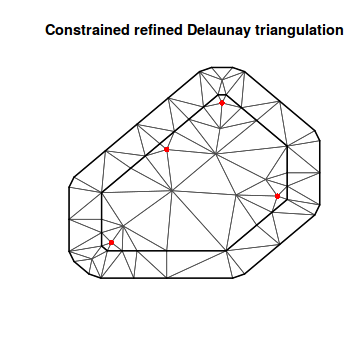
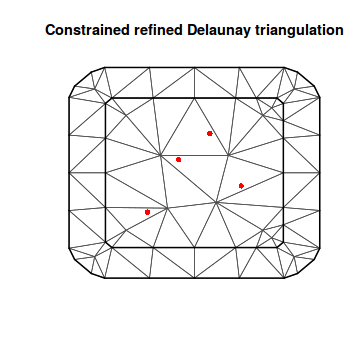
The value of any point is created by projecting this point onto a plane formed by the triangle it is positioned in. The exact value of the point is the weighted average of three weights associated with each vertex. To illustrate this, it might be best to deviate from our working set of coordinates and mesh and generate a very small number of points.
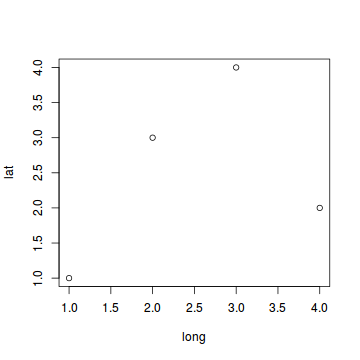
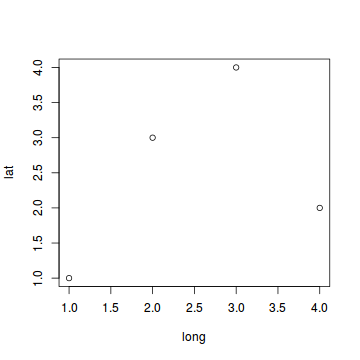
To better appreciate the weights that are applied to each vertex, we will create two examples. One where the points are on the vertices (and thus weights are either 0 or one) and another example where the points are not necessarily on the vertices and thus each point will be associated with up to three non-zero weights (that must collectively add up to 1).
set.seed(12)
n <- 4
coords2 <- cbind(long = sample(1:n), lat = sample(1:n))
plot(coords2)
mesh9 <- inla.mesh.2d(coords2, max.edge = c(50, 50))
plot(mesh9)
points(coords2, col = "red", pch = 16)
A9 <- inla.spde.make.A(mesh9, loc = coords2)
str(A9)
Formal class 'dgCMatrix' [package "Matrix"] with 6 slots
  ..@ i       : int [1:12] 2 1 3 0 2 0 1 2 3 1 ...
  ..@ p       : int [1:63] 0 0 0 0 0 0 0 0 0 1 ...
  ..@ Dim     : int [1:2] 4 62
  ..@ Dimnames:List of 2
  .. ..$ : NULL
  .. ..$ : NULL
  ..@ x       : num [1:12] 0 0 0 0 0 1 1 1 1 0 ...
  ..@ factors : list()
dim(A9)
[1] 4 62
A9
4 x 62 sparse Matrix of class "dgCMatrix"

[1,] . . . . . . . . . . . . . . . . . . . . 0 . . . . 1 . . . . . . . . 0 . .
[2,] . . . . . . . . . . . . . . . . 0 . . . . . . . . . 1 . . . . . 0 . . . .
[3,] . . . . . . . . 0 . . . . . . . . . . . . . . 0 . . . 1 . . . . . . . . .
[4,] . . . . . . . . . . . . . . . . . . . 0 . . . . . . . . 1 . . . . 0 . . .

[1,] . . . . . . . . . . . . . . . . . . . . . . . . .
[2,] . . . . . . . . . . . . . . . . . . . . . . . . .
[3,] . . . . . . . . . . . . . . . . . . . . . . . . .
[4,] . . . . . . . . . . . . . . . . . . . . . . . . .
table(rowSums(A9 > 0))
1
4
table(rowSums(A9))
1
4
table(colSums(A9) > 0)
FALSE  TRUE
   58     4
The A9 object is a sparse matrix that relates (via weights) the observed points (rows) to all the vertices (columns).
The mesh contained 62 vertices. However, of these, only 4
columns contain data.
set.seed(12)
n <- 4
coords2 <- cbind(long = sample(1:n), lat = sample(1:n))
plot(coords2)
boundary <- cbind(c(0, 5, 5, 0), c(0, 0, 5, 5))
mesh10 <- inla.mesh.2d(loc.domain = boundary, max.edge = c(4, 4))
plot(mesh10)
points(coords2, col = "red", pch = 16)
A10 <- inla.spde.make.A(mesh10, loc = coords2)
str(A10)
Formal class 'dgCMatrix' [package "Matrix"] with 6 slots
  ..@ i       : int [1:12] 1 3 0 0 1 2 3 1 2 2 ...
  ..@ p       : int [1:67] 0 0 0 0 0 0 0 0 0 1 ...
  ..@ Dim     : int [1:2] 4 66
  ..@ Dimnames:List of 2
  .. ..$ : NULL
  .. ..$ : NULL
  ..@ x       : num [1:12] 0.382 0.349 0.197 0.185 0.539 ...
  ..@ factors : list()
dim(A10)
[1] 4 66
round(A10, 2)
4 x 66 sparse Matrix of class "dgCMatrix"

[1,] . . . . . . . . .    .    . . . 0.2 . . . . . . . . . . . . 0.18 . .
[2,] . . . . . . . . 0.38 .    . . . .   . . . . . . . . . . . . .    . 0.54
[3,] . . . . . . . . .    .    . . . .   . . . . . . . . . . . . .    . 0.20
[4,] . . . . . . . . .    0.35 . . . .   . . . . . . . . . . . . .    . 0.13

[1,] .    .    0.62 . . . . . . . . . . . . . . . . . . . . . . . . . . . . . .
[2,] 0.08 .    .    . . . . . . . . . . . . . . . . . . . . . . . . . . . . . .
[3,] 0.71 0.09 .    . . . . . . . . . . . . . . . . . . . . . . . . . . . . . .
[4,] .    0.52 .    . . . . . . . . . . . . . . . . . . . . . . . . . . . . . .

[1,] . . . .
[2,] . . . .
[3,] . . . .
[4,] . . . .
table(rowSums(A10 > 0))
3
4
table(rowSums(A10))
1
4
table(colSums(A10) > 0)
FALSE  TRUE
   58     8
We now return to our data..
A <- inla.spde.make.A(mesh, loc = coords)
str(A)
Formal class 'dgCMatrix' [package "Matrix"] with 6 slots
  ..@ i       : int [1:300] 23 17 86 46 54 15 97 83 60 92 ...
  ..@ p       : int [1:224] 0 1 2 2 3 3 3 3 5 7 ...
  ..@ Dim     : int [1:2] 100 223
  ..@ Dimnames:List of 2
  .. ..$ : NULL
  .. ..$ : NULL
  ..@ x       : num [1:300] 0 0 0 0 0 0 0 0 0 0 ...
  ..@ factors : list()
dim(A)
[1] 100 223
table(rowSums(A > 0))
  1
100
table(rowSums(A))
  1
100
table(colSums(A) > 0)
FALSE  TRUE
  123   100
The stack
It is possible for models to include multiple projector matrices - eg. Lindgren, 2012, Cameletti et al, 2012 anmd Lindgren and Rue, 2013.
The inla stack allows us to work with predictors that include terms with different dimensions.
stack <- inla.stack(data = list(y = coords.df$y), A = list(A, 1), effects = list(s.index,
    list(Intercept = rep(1, nrow(coords.df)))), tag = "est")
Note that the inla.stack() function automatically eliminates all the elements associated with columns that sum to zero.
dim(inla.stack.A(stack))
[1] 100 101
Fitting the INLA model
data.inla <- inla(y ~ 0 + Intercept + f(spatial.field, model = spde), data = inla.stack.data(stack),
    control.predictor = list(A = inla.stack.A(stack)))
summary(data.inla)
Call:
c("inla(formula = y ~ 0 + Intercept + f(spatial.field, model = spde), ",  "    data = inla.stack.data(stack), control.predictor = list(A = inla.stack.A(stack)))" )

Time used:
 Pre-processing    Running inla Post-processing           Total
         0.5985          0.8630          0.0458          1.5073

Fixed effects:
            mean     sd 0.025quant 0.5quant 0.975quant    mode kld
Intercept 10.008 0.2266     9.5619  10.0078     10.455 10.0073   0

Random effects:
Name	  Model
 spatial.field   SPDE2 model

Model hyperparameters:
                                           mean     sd 0.025quant 0.5quant
Precision for the Gaussian observations  0.2197 0.0278     0.1649   0.2203
Theta1 for spatial.field                 2.1413 2.5020    -2.4934   2.0218
Theta2 for spatial.field                -0.5379 1.6146    -3.2479  -0.7125
                                        0.975quant   mode
Precision for the Gaussian observations     0.2736  0.224
Theta1 for spatial.field                    7.3201  1.591
Theta2 for spatial.field                    3.0353 -1.363

Expected number of effective parameters(std dev): 3.502(2.897)
Number of equivalent replicates : 28.55

Marginal log-Likelihood:  -234.61
Since we have simulated these data, we can see how well we were able to recover the defining parameters:
- Intercept = 10
- sigma2e=0.3
- sigma2x=5
- kappa=7
- nu=1
## Intercept
data.inla$summary.fix
              mean        sd 0.025quant 0.5quant 0.975quant     mode
Intercept 10.00803 0.2266212   9.561947 10.00776   10.45499 10.00725
                  kld
Intercept 7.60943e-13
## sigma2e - note, this is on a precision scale and so needs to be converted to
## standard deviation scale
post.se <- inla.tmarginal(function(x) sqrt(1/x), data.inla$marginals.hy[[1]])

inla.emarginal(function(x) x, post.se)
[1] 2.146443
inla.hpdmarginal(0.95, post.se)
                low     high
level:0.95 1.895175 2.431498
data.inla.field <- inla.spde2.result(data.inla, "spatial.field", spde, do.transf = TRUE)
inla.emarginal(function(x) x, data.inla.field$marginals.kappa[[1]])
[1] 2.786834
inla.emarginal(function(x) x, data.inla.field$marginals.variance.nominal[[1]])
[1] 0.04743584
Prediction
Prediction involves projecting the fitted model into the mesh at the specific spatial locations of interest (i.e. our spatial grid). Recall that the spatial model is included as a random effect and therefore all coeffients sum to zero - that is, they are deviations from the overal mean (Intercept). Hence to project onto the response scale, we must add the estimated intercept.head(coords.df)
  long lat         y
1   27  66 11.521206
2   37  35  5.273678
3   57  27  6.548568
4   89  97 13.387033
5   20  61 13.359189
6   86  21 10.322624
coords.grid <- as.matrix(expand.grid(long = seq(0, 100, len = 100), lat = seq(0,
    100, len = 100)))
head(coords.grid)
         long lat
[1,] 0.000000   0
[2,] 1.010101   0
[3,] 2.020202   0
[4,] 3.030303   0
[5,] 4.040404   0
[6,] 5.050505   0
data.inla.projector <- inla.mesh.projector(mesh, loc = coords.grid)
newdata <- data.frame(coords.grid, mean = inla.mesh.project(data.inla.projector,
    data.inla$summary.random$spatial.field$mean) + data.inla$summary.fixed$mean[1])
str(newdata$mean)
num [1:10000] 9.98 9.98 9.98 9.98 9.97 ...
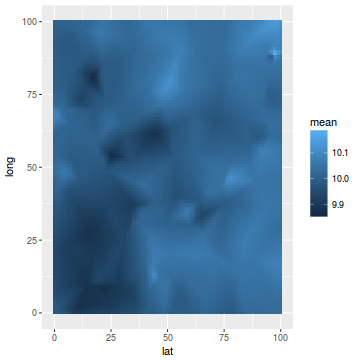
ggplot(newdata, aes(y = long, x = lat)) + geom_tile(aes(fill = mean))
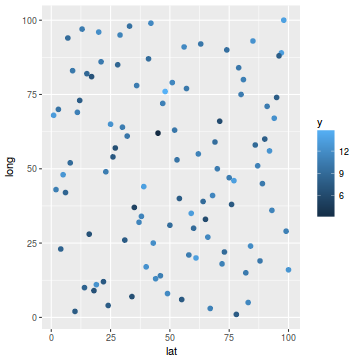
ggplot(coords.df, aes(y = long, x = lat)) + geom_point(aes(color = y), size = 2)
library(mgcv)
dat.gamm <- gam(y ~ s(long, lat), data = coords.df)
newdata$y1 <- predict(dat.gamm, newdata = newdata)
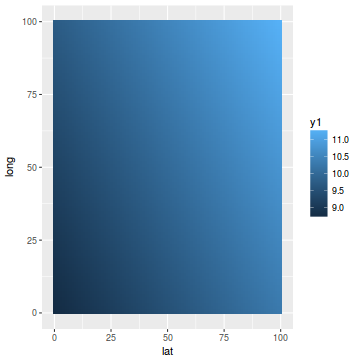
ggplot(newdata, aes(y = long, x = lat)) + geom_tile(aes(fill = y1))
coords.df$pred = data.inla$summary.fix[1, 1] + drop(A %*% data.inla$summary.random$spatial.field$mean)
ggplot(coords.df, aes(y = pred, x = y)) + geom_point()
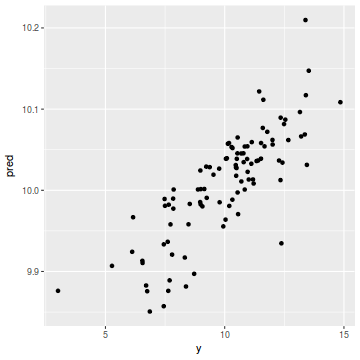
cor(coords.df$y, coords.df$pred)
[1] 0.8134691
ggplot(coords.df, aes(y = predict(dat.gamm), x = y)) + geom_point()
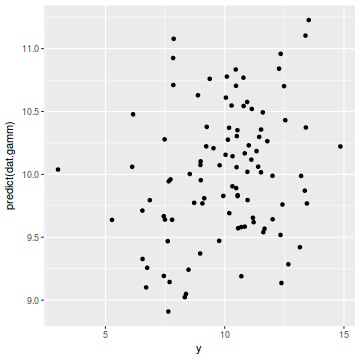
cor(coords.df$y, predict(dat.gamm))
[1] 0.2471316
stack.e <- inla.stack(data = list(y = coords.df$y), A = list(A, 1, 1, 1), effects = list(s.index,
    list(Intercept = rep(1, nrow(coords.df))), list(long = coords.df$long), list(lat = coords.df$lat)),
    tag = "est")

newdata = data.frame(long = mesh$loc[, 1], lat = mesh$loc[, 2])

A.p = Diagonal(n = nrow(newdata))
stack.p = inla.stack(data = list(y = NA), A = list(A.p, 1, 1, 1), effects = list(s.index,
    list(Intercept = rep(1, nrow(newdata))), list(lon = newdata$lon), list(lat = newdata$lat)),
    tag = "pred")
stack = inla.stack(stack.e, stack.p)
Note that the inla.stack() function automatically eliminates all the elements associated with columns that sum to zero.
dim(inla.stack.A(stack))
[1] 323 716
data.inla <- inla(y ~ 0 + Intercept + lat + long + f(spatial.field, model = spde),
    data = inla.stack.data(stack), control.predictor = list(A = inla.stack.A(stack),
        compute = TRUE))
summary(data.inla)
Call:
c("inla(formula = y ~ 0 + Intercept + lat + long + f(spatial.field, ",  "    model = spde), data = inla.stack.data(stack), control.predictor = list(A = inla.stack.A(stack), ",  "    compute = TRUE))")

Time used:
 Pre-processing    Running inla Post-processing           Total
         0.4937          1.5364          0.1319          2.1620

Fixed effects:
            mean     sd 0.025quant 0.5quant 0.975quant   mode kld
Intercept 8.6925 0.5964     7.5101   8.6948     9.8605 8.6993   0
lat       0.0156 0.0076     0.0006   0.0156     0.0307 0.0156   0
long      0.0104 0.0076    -0.0046   0.0103     0.0255 0.0103   0

Random effects:
Name	  Model
 spatial.field   SPDE2 model

Model hyperparameters:
                                           mean     sd 0.025quant 0.5quant
Precision for the Gaussian observations  0.2312 0.0352     0.1609   0.2325
Theta1 for spatial.field                 3.4591 2.9245    -0.7670   2.9735
Theta2 for spatial.field                -0.0356 1.0841    -1.5648  -0.2240
                                        0.975quant    mode
Precision for the Gaussian observations     0.2966  0.2392
Theta1 for spatial.field                   10.2423  0.8022
Theta2 for spatial.field                    2.4962 -1.0336

Expected number of effective parameters(std dev): 8.322(5.32)
Number of equivalent replicates : 12.02

Marginal log-Likelihood:  -250.03
Posterior marginals for linear predictor and fitted values computed
head(coords.df)
  long lat         y      pred
1   27  66 11.521206 10.038941
2   37  35  5.273678  9.906943
3   57  27  6.548568  9.913135
4   89  97 13.387033 10.209700
5   20  61 13.359189 10.068761
6   86  21 10.322624  9.988433
coords.grid <- as.matrix(expand.grid(long = seq(0, 100, len = 100), lat = seq(0,
    100, len = 100)))
head(coords.grid)
         long lat
[1,] 0.000000   0
[2,] 1.010101   0
[3,] 2.020202   0
[4,] 3.030303   0
[5,] 4.040404   0
[6,] 5.050505   0
data.inla.projector <- inla.mesh.projector(mesh, loc = coords.grid)

p.index = inla.stack.index(stack, "pred")$data
data.means = data.inla$summary.fitted.values$mean[p.index]

fit = sd = NULL
newdata = cbind(coords.grid, mean = c(inla.mesh.project(data.inla.projector, data.means)))
newdata = data.frame(newdata)
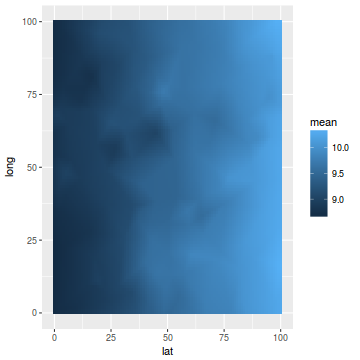
ggplot(newdata, aes(y = long, x = lat)) + geom_tile(aes(fill = mean))
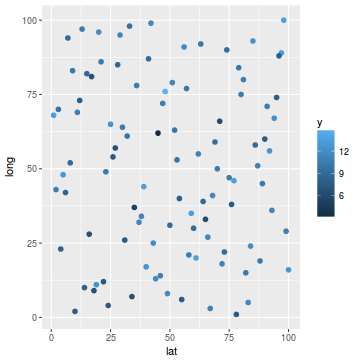
ggplot(coords.df, aes(y = long, x = lat)) + geom_point(aes(color = y), size = 2)
library(mgcv)
dat.gamm <- gam(y ~ s(long, lat), data = coords.df)
newdata$y1 <- predict(dat.gamm, newdata = newdata)
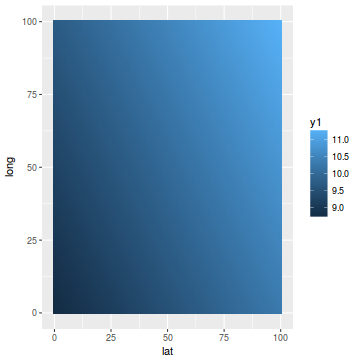
ggplot(newdata, aes(y = long, x = lat)) + geom_tile(aes(fill = y1))
coords.df$pred = data.inla$summary.fix[1, 1] + drop(A %*% data.inla$summary.random$spatial.field$mean)
ggplot(coords.df, aes(y = pred, x = y)) + geom_point()
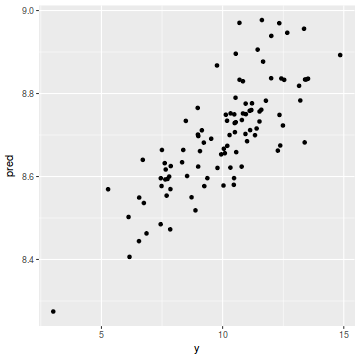
cor(coords.df$y, coords.df$pred)
[1] 0.7852556
ggplot(coords.df, aes(y = predict(dat.gamm), x = y)) + geom_point()
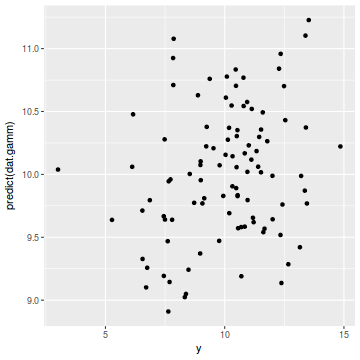
cor(coords.df$y, predict(dat.gamm))
[1] 0.2471316
Spatio-temporal
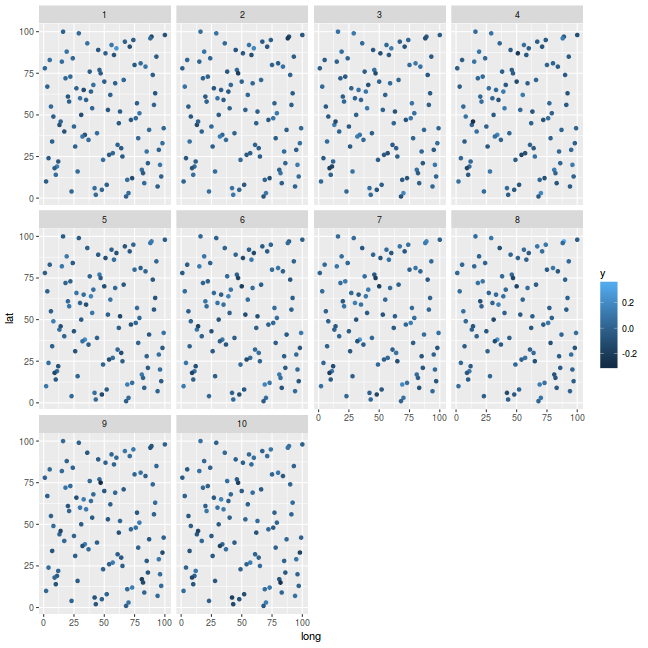
Illustrate spatial pattern at discrete time intervals. We will start by just extending the previous spatial example. Lets say we had ten years of data.
Simulate data
rspde <- function(coords, kappa, variance = 1, alpha = 2, n = 1, mesh, verbose = FALSE,
    seed, return.attributes = FALSE) {
    t0 <- Sys.time()
    theta <- c(-0.5 * log(4 * pi * variance * kappa^2), log(kappa))
    if (verbose)
        cat("theta =", theta, "\n")
    if (missing(mesh)) {
        mesh.pars <- c(0.5, 1, 0.1, 0.5, 1) * sqrt(alpha - ncol(coords)/2)/kappa
        if (verbose)
            cat("mesh.pars =", mesh.pars, "\n")
        attributes <- list(mesh = inla.mesh.2d(, coords[chull(coords), ], max.edge = mesh.pars[1:2],
            cutoff = mesh.pars[3], offset = mesh.pars[4:5]))
        if (verbose)
            cat("n.mesh =", attributes$mesh$n, "\n")
    } else attributes <- list(mesh = mesh)
    attributes$spde <- inla.spde2.matern(attributes$mesh, alpha = alpha)
    attributes$Q <- inla.spde2.precision(attributes$spde, theta = theta)
    attributes$A <- inla.mesh.project(mesh = attributes$mesh, loc = coords)$A
    if (n == 1)
        result <- drop(attributes$A %*% inla.qsample(Q = attributes$Q, constr = attributes$spde$f$extraconstr))
    t1 <- Sys.time()
    result <- inla.qsample(n, attributes$Q, seed = ifelse(missing(seed), 0, seed),
        constr = attributes$spde$f$extraconstr)
    if (nrow(result) < nrow(attributes$A)) {
        result <- rbind(result, matrix(NA, nrow(attributes$A) - nrow(result), ncol(result)))
        dimnames(result)[[1]] <- paste("x", 1:nrow(result), sep = "")
        for (j in 1:ncol(result)) result[, j] <- drop(attributes$A %*% result[1:ncol(attributes$A),
            j])
    } else {
        for (j in 1:ncol(result)) result[1:nrow(attributes$A), j] <- drop(attributes$A %*%
            result[, j])
        result <- result[1:nrow(attributes$A), ]
    }
    t2 <- Sys.time()
    attributes$cpu <- c(prep = t1 - t0, sample = t2 - t1, total = t2 - t0)
    if (return.attributes)
        attributes(result) <- c(attributes(result), attributes)
    return(drop(result))
}
We start by making $k=10$ realizations from the mesh we defined earlier.
k = 10
kappa = 7
nu = 1
rho = 0.7  # degree of temporal autocorrelation
x.k <- rspde(coords, kappa = 7, n = k, mesh = mesh, return.attributes = TRUE)
class(x.k)
[1] "matrix"
str(x.k)
 num [1:100, 1:10] -0.000627 0.058355 0.020546 -0.183822 -0.055067 ...
 - attr(*, "dimnames")=List of 2
  ..$ : chr [1:100] "x1" "x2" "x3" "x4" ...
  ..$ : chr [1:10] "sample1" "sample2" "sample3" "sample4" ...
 - attr(*, "mesh")=List of 8
  ..$ meta    :List of 5
  .. ..$ call        : language inla.mesh.create(loc = rbind(loc, mesh2$loc), boundary = boundary[[2]],      interior = c(boundary2, interior2), extend = list(n = n[2], offset = offset[2]),  ...
  .. ..$ fmesher.args: chr "--input=input.s --cutoff=1e-12  --interior=input.segm.int.idx  --interiorgrp=input.segm.int.grp --cet=16,-0.15 --rcdt=21,40,40 "| __truncated__
  .. ..$ time        : num [1:5, 1:5] 0 0 0 0 0 0 0 0 0 0 ...
  .. .. ..- attr(*, "dimnames")=List of 2
  .. .. .. ..$ : chr [1:5] "pre" "fmesher" "post" "object" ...
  .. .. .. ..$ : NULL
  .. ..$ prefix      : chr "/tmp/RtmpnLy1Nt/fmesher3e541a5fea57."
  .. ..$ is.refined  : logi TRUE
  ..$ manifold: chr "R2"
  ..$ n       : int 223
  ..$ loc     : num [1:223, 1:3] 8.28 90.72 106.58 106.58 100.72 ...
  ..$ graph   :List of 5
  .. ..$ tv : int [1:415, 1:3] 29 127 73 64 200 26 50 49 12 23 ...
  .. ..$ vt : int [1:223, 1] 12 21 36 414 53 7 10 85 11 35 ...
  .. ..$ tt : int [1:415, 1:3] 26 212 161 91 53 372 69 113 65 111 ...
  .. ..$ tti: int [1:415, 1:3] 1 3 1 3 1 1 2 1 2 2 ...
  .. ..$ vv :Formal class 'dgTMatrix' [package "Matrix"] with 6 slots
  .. .. .. ..@ i       : int [1:1274] 26 37 61 95 192 207 20 30 55 127 ...
  .. .. .. ..@ j       : int [1:1274] 0 0 0 0 0 0 1 1 1 1 ...
  .. .. .. ..@ Dim     : int [1:2] 223 223
  .. .. .. ..@ Dimnames:List of 2
  .. .. .. .. ..$ : NULL
  .. .. .. .. ..$ : NULL
  .. .. .. ..@ x       : num [1:1274] 1 1 1 1 1 1 1 1 1 1 ...
  .. .. .. ..@ factors : list()
  ..$ segm    :List of 2
  .. ..$ bnd:List of 5
  .. .. ..$ loc   : NULL
  .. .. ..$ idx   : int [1:29, 1:2] 193 218 211 217 194 195 196 197 221 213 ...
  .. .. ..$ grp   : int [1:29, 1] 0 0 0 0 0 0 0 0 0 0 ...
  .. .. ..$ is.bnd: logi TRUE
  .. .. ..$ crs   : NULL
  .. .. ..- attr(*, "class")= chr "inla.mesh.segment"
  .. ..$ int:List of 5
  .. .. ..$ loc   : NULL
  .. .. ..$ idx   : int [1:38, 1:2] 1 38 17 25 9 33 14 31 2 21 ...
  .. .. ..$ grp   : int [1:38, 1] 0 0 0 0 0 0 0 0 0 0 ...
  .. .. ..$ is.bnd: logi FALSE
  .. .. ..$ crs   : NULL
  .. .. ..- attr(*, "class")= chr "inla.mesh.segment"
  ..$ idx     :List of 2
  .. ..$ loc    : int [1:100] 39 40 41 42 43 44 45 46 47 48 ...
  .. ..$ lattice: NULL
  ..$ crs     : NULL
  ..- attr(*, "class")= chr "inla.mesh"
 - attr(*, "spde")=List of 7
  ..$ model     : chr "matern"
  ..$ n.spde    : int 223
  ..$ n.theta   : int 2
  ..$ param.inla:List of 15
  .. ..$ n            : int 223
  .. ..$ n.theta      : int 2
  .. ..$ M0           :Formal class 'dgTMatrix' [package "Matrix"] with 6 slots
  .. .. .. ..@ i       : int [1:223] 0 1 2 3 4 5 6 7 8 9 ...
  .. .. .. ..@ j       : int [1:223] 0 1 2 3 4 5 6 7 8 9 ...
  .. .. .. ..@ Dim     : int [1:2] 223 223
  .. .. .. ..@ Dimnames:List of 2
  .. .. .. .. ..$ : NULL
  .. .. .. .. ..$ : NULL
  .. .. .. ..@ x       : num [1:223] 190 171 208 117 129 ...
  .. .. .. ..@ factors : list()
  .. ..$ M1           :Formal class 'dgTMatrix' [package "Matrix"] with 6 slots
  .. .. .. ..@ i       : int [1:1497] 0 26 37 61 95 192 207 1 20 30 ...
  .. .. .. ..@ j       : int [1:1497] 0 0 0 0 0 0 0 1 1 1 ...
  .. .. .. ..@ Dim     : int [1:2] 223 223
  .. .. .. ..@ Dimnames:List of 2
  .. .. .. .. ..$ : NULL
  .. .. .. .. ..$ : NULL
  .. .. .. ..@ x       : num [1:1497] 5.1604 -2.1409 -1.9881 -0.0821 -0.0883 ...
  .. .. .. ..@ factors : list()
  .. ..$ M2           :Formal class 'dgTMatrix' [package "Matrix"] with 6 slots
  .. .. .. ..@ i       : int [1:4041] 0 7 16 26 37 61 65 84 95 108 ...
  .. .. .. ..@ j       : int [1:4041] 0 0 0 0 0 0 0 0 0 0 ...
  .. .. .. ..@ Dim     : int [1:2] 223 223
  .. .. .. ..@ Dimnames:List of 2
  .. .. .. .. ..$ : NULL
  .. .. .. .. ..$ : NULL
  .. .. .. ..@ x       : num [1:4041] 0.1841 0.0137 0.0143 -0.1095 -0.1042 ...
  .. .. .. ..@ factors : list()
  .. ..$ B0           : num [1:223, 1:3] 0 0 0 0 0 0 0 0 0 0 ...
  .. ..$ B1           : num [1:223, 1:3] 0 0 0 0 0 0 0 0 0 0 ...
  .. ..$ B2           : num [1:223, 1:3] 1 1 1 1 1 1 1 1 1 1 ...
  .. .. ..- attr(*, "dimnames")=List of 2
  .. .. .. ..$ : NULL
  .. .. .. ..$ : chr [1:3] "B" "" ""
  .. ..$ BLC          : num [1:6, 1:3] 0 0 0 0 -2.53 ...
  .. .. ..- attr(*, "dimnames")=List of 2
  .. .. .. ..$ : chr [1:6] "theta.1" "theta.2" "tau.1" "kappa.1" ...
  .. .. .. ..$ : NULL
  .. ..$ theta.mu     : num [1:2] 1.13 -2.4
  .. ..$ theta.Q      : num [1:2, 1:2] 0.1 0 0 0.1
  .. ..$ transform    : chr "identity"
  .. ..$ theta.initial: num [1:2] 1.13 -2.4
  .. ..$ fixed        : logi [1:2] FALSE FALSE
  .. ..$ theta.fixed  : num(0)
  ..$ f         :List of 4
  .. ..$ model          : chr "spde2"
  .. ..$ n              : int 223
  .. ..$ spde2.transform: chr "identity"
  .. ..$ hyper.default  :List of 2
  .. .. ..$ theta1:List of 3
  .. .. .. ..$ prior  : chr "mvnorm"
  .. .. .. ..$ param  : num [1:6] 1.13 -2.4 0.1 0 0 ...
  .. .. .. ..$ initial: num 1.13
  .. .. ..$ theta2:List of 1
  .. .. .. ..$ initial: num -2.4
  ..$ BLC       : num [1:6, 1:3] 0 0 0 0 -2.53 ...
  .. ..- attr(*, "dimnames")=List of 2
  .. .. ..$ : chr [1:6] "theta.1" "theta.2" "tau.1" "kappa.1" ...
  .. .. ..$ : NULL
  ..$ mesh      :List of 8
  .. ..$ meta    :List of 5
  .. .. ..$ call        : language inla.mesh.create(loc = rbind(loc, mesh2$loc), boundary = boundary[[2]],      interior = c(boundary2, interior2), extend = list(n = n[2], offset = offset[2]),  ...
  .. .. ..$ fmesher.args: chr "--input=input.s --cutoff=1e-12  --interior=input.segm.int.idx  --interiorgrp=input.segm.int.grp --cet=16,-0.15 --rcdt=21,40,40 "| __truncated__
  .. .. ..$ time        : num [1:5, 1:5] 0 0 0 0 0 0 0 0 0 0 ...
  .. .. .. ..- attr(*, "dimnames")=List of 2
  .. .. .. .. ..$ : chr [1:5] "pre" "fmesher" "post" "object" ...
  .. .. .. .. ..$ : NULL
  .. .. ..$ prefix      : chr "/tmp/RtmpnLy1Nt/fmesher3e541a5fea57."
  .. .. ..$ is.refined  : logi TRUE
  .. ..$ manifold: chr "R2"
  .. ..$ n       : int 223
  .. ..$ loc     : num [1:223, 1:3] 8.28 90.72 106.58 106.58 100.72 ...
  .. ..$ graph   :List of 5
  .. .. ..$ tv : int [1:415, 1:3] 29 127 73 64 200 26 50 49 12 23 ...
  .. .. ..$ vt : int [1:223, 1] 12 21 36 414 53 7 10 85 11 35 ...
  .. .. ..$ tt : int [1:415, 1:3] 26 212 161 91 53 372 69 113 65 111 ...
  .. .. ..$ tti: int [1:415, 1:3] 1 3 1 3 1 1 2 1 2 2 ...
  .. .. ..$ vv :Formal class 'dgTMatrix' [package "Matrix"] with 6 slots
  .. .. .. .. ..@ i       : int [1:1274] 26 37 61 95 192 207 20 30 55 127 ...
  .. .. .. .. ..@ j       : int [1:1274] 0 0 0 0 0 0 1 1 1 1 ...
  .. .. .. .. ..@ Dim     : int [1:2] 223 223
  .. .. .. .. ..@ Dimnames:List of 2
  .. .. .. .. .. ..$ : NULL
  .. .. .. .. .. ..$ : NULL
  .. .. .. .. ..@ x       : num [1:1274] 1 1 1 1 1 1 1 1 1 1 ...
  .. .. .. .. ..@ factors : list()
  .. ..$ segm    :List of 2
  .. .. ..$ bnd:List of 5
  .. .. .. ..$ loc   : NULL
  .. .. .. ..$ idx   : int [1:29, 1:2] 193 218 211 217 194 195 196 197 221 213 ...
  .. .. .. ..$ grp   : int [1:29, 1] 0 0 0 0 0 0 0 0 0 0 ...
  .. .. .. ..$ is.bnd: logi TRUE
  .. .. .. ..$ crs   : NULL
  .. .. .. ..- attr(*, "class")= chr "inla.mesh.segment"
  .. .. ..$ int:List of 5
  .. .. .. ..$ loc   : NULL
  .. .. .. ..$ idx   : int [1:38, 1:2] 1 38 17 25 9 33 14 31 2 21 ...
  .. .. .. ..$ grp   : int [1:38, 1] 0 0 0 0 0 0 0 0 0 0 ...
  .. .. .. ..$ is.bnd: logi FALSE
  .. .. .. ..$ crs   : NULL
  .. .. .. ..- attr(*, "class")= chr "inla.mesh.segment"
  .. ..$ idx     :List of 2
  .. .. ..$ loc    : int [1:100] 39 40 41 42 43 44 45 46 47 48 ...
  .. .. ..$ lattice: NULL
  .. ..$ crs     : NULL
  .. ..- attr(*, "class")= chr "inla.mesh"
  ..- attr(*, "class")= chr [1:3] "inla.spde2" "inla.spde" "inla.model.class"
 - attr(*, "Q")=Formal class 'dgCMatrix' [package "Matrix"] with 6 slots
  .. ..@ i       : int [1:4041] 0 7 16 26 37 61 65 84 95 108 ...
  .. ..@ p       : int [1:224] 0 17 34 51 67 87 100 116 133 150 ...
  .. ..@ Dim     : int [1:2] 223 223
  .. ..@ Dimnames:List of 2
  .. .. ..$ : NULL
  .. .. ..$ : NULL
  .. ..@ x       : num [1:4041] 7.43e+02 2.23e-05 2.33e-05 -3.41e-01 -3.17e-01 ...
  .. ..@ factors : list()
 - attr(*, "A")=Formal class 'dgCMatrix' [package "Matrix"] with 6 slots
  .. ..@ i       : int [1:300] 23 17 86 46 54 15 97 83 60 92 ...
  .. ..@ p       : int [1:224] 0 1 2 2 3 3 3 3 5 7 ...
  .. ..@ Dim     : int [1:2] 100 223
  .. ..@ Dimnames:List of 2
  .. .. ..$ : NULL
  .. .. ..$ : NULL
  .. ..@ x       : num [1:300] 0 0 0 0 0 0 0 0 0 0 ...
  .. ..@ factors : list()
 - attr(*, "cpu")=Class 'difftime'  atomic [1:3] 0.0691 0.0267 0.0958
  .. ..- attr(*, "units")= Named chr "secs"
  .. .. ..- attr(*, "names")= chr "prep"
## add squared exponential autoregressive structure
x <- x.k
for (j in 2:k) x[, j] <- rho * x[, j - 1] + sqrt(1 - rho^2) * x.k[, j]
dim(x)
[1] 100 10
library(dplyr)
library(reshape2)
x <- data.frame(x) %>% melt()
head(x)
  variable         value
1  sample1 -0.0006269303
2  sample1  0.0583550105
3  sample1  0.0205464030
4  sample1 -0.1838224593
5  sample1 -0.0550666120
6  sample1 -0.0263546934
## expand the coords into a data frame that is repeated for each time.
coords.st <- Reduce("rbind", lapply(1:k, function(x) data.frame(Year = x, coords)))
head(coords.st)
  Year long lat
1    1   27  66
2    1   37  35
3    1   57  27
4    1   89  97
5    1   20  61
6    1   86  21
coords.st$y = x$value
head(coords.st)
  Year long lat             y
1    1   27  66 -0.0006269303
2    1   37  35  0.0583550105
3    1   57  27  0.0205464030
4    1   89  97 -0.1838224593
5    1   20  61 -0.0550666120
6    1   86  21 -0.0263546934
ggplot(coords.st, aes(y = lat, x = long)) + geom_point(aes(color = y)) + facet_wrap(~Year)
spde <- attr(x.k, "spde")
SPDE model
coords = as.data.frame(coords.st) %>% dplyr:::select(long, lat) %>% distinct %>%
    as.matrix
mesh <- inla.mesh.2d(coords, max.edge = c(10, 40))
plot(mesh)
points(coords, col = "red", pch = 16)
spde <- inla.spde2.matern(mesh, alpha = 2)
s.index <- inla.spde.make.index("spatial.field", n.spde = spde$n.spde, n.group = k)
tail(s.index$spatial.field.group)
[1] 10 10 10 10 10 10
tail(s.index$spatial.field.repl)
[1] 1 1 1 1 1 1
str(s.index)
List of 3
 $ spatial.field      : int [1:4520] 1 2 3 4 5 6 7 8 9 10 ...
 $ spatial.field.group: int [1:4520] 1 1 1 1 1 1 1 1 1 1 ...
 $ spatial.field.repl : int [1:4520] 1 1 1 1 1 1 1 1 1 1 ...
str(inla.spde.make.index("spatial.field", n.spde = spde$n.spde, n.repl = k))
List of 3
 $ spatial.field      : int [1:4520] 1 2 3 4 5 6 7 8 9 10 ...
 $ spatial.field.group: int [1:4520] 1 1 1 1 1 1 1 1 1 1 ...
 $ spatial.field.repl : int [1:4520] 1 1 1 1 1 1 1 1 1 1 ...
tail(inla.spde.make.index("spatial.field", n.spde = spde$n.spde, n.repl = k)$spatial.field.group)
[1] 1 1 1 1 1 1
tail(inla.spde.make.index("spatial.field", n.spde = spde$n.spde, n.repl = k)$spatial.field.repl)
[1] 10 10 10 10 10 10
## What is the difference between a group and a repl?
The projector matrix
A <- inla.spde.make.A(mesh = mesh, loc = as.matrix(coords.st[, c("long", "lat")]),
    group = coords.st$Year)
The stack
stack <- inla.stack(data = list(y = coords.st$y), A = list(A, 1), effects = list(s.index,
    list(Intercept = rep(1, nrow(coords.st)))), tag = "est")
Fit the INLA model
form <- y ~ 0 + Intercept + f(spatial.field, model = spde, group = spatial.field.group,
    control.group = list(model = "ar1"))
data.inla <- inla(form, data = inla.stack.data(stack), control.predictor = list(compute = TRUE,
    A = inla.stack.A(stack)), control.fixed = list(expand.factor.strategy = "inla"))
summary(data.inla)
Call:
c("inla(formula = form, data = inla.stack.data(stack), control.predictor = list(compute = TRUE, ",  "    A = inla.stack.A(stack)), control.fixed = list(expand.factor.strategy = \"inla\"))" )

Time used:
 Pre-processing    Running inla Post-processing           Total
         0.6240        565.6171          0.8941        567.1352

Fixed effects:
            mean     sd 0.025quant 0.5quant 0.975quant   mode kld
Intercept 0.0034 0.0047    -0.0057   0.0034     0.0126 0.0034   0

Random effects:
Name	  Model
 spatial.field   SPDE2 model

Model hyperparameters:
                                              mean        sd 0.025quant
Precision for the Gaussian observations 39352.1888 2.395e+04 10581.3728
Theta1 for spatial.field                   -1.1877 2.387e+00    -4.7099
Theta2 for spatial.field                    1.0238 1.233e+00    -1.5756
GroupRho for spatial.field                  0.6844 2.810e-02     0.6305
                                          0.5quant 0.975quant       mode
Precision for the Gaussian observations 33798.4024  1.013e+05 24399.5345
Theta1 for spatial.field                   -1.5211  3.773e+00    -3.9537
Theta2 for spatial.field                    1.1982  2.837e+00     2.4408
GroupRho for spatial.field                  0.6838  7.401e-01     0.6805

Expected number of effective parameters(std dev): 980.10(12.10)
Number of equivalent replicates : 1.02

Marginal log-Likelihood:  1531.66
Posterior marginals for linear predictor and fitted values computed
rf <- inla.spde2.result(data.inla, "spatial.field", spde, do.transf = TRUE)
# str(rf)

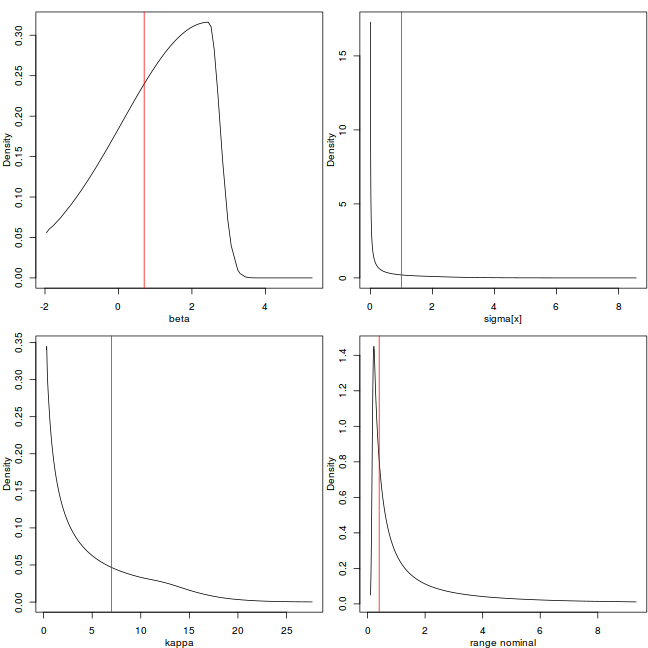
par(mfrow = c(2, 2), mar = c(3, 3, 1, 0.1), mgp = 2:0)
plot(data.inla$marginals.hyper[[3]], type = "l", xlab = "beta", ylab = "Density")
abline(v = rho, col = 2)
plot(rf$marginals.variance.nominal[[1]], type = "l", xlab = "sigma[x]", ylab = "Density")
abline(v = nu, col = 2)
plot(rf$marginals.kappa[[1]], type = "l", xlab = "kappa", ylab = "Density")
abline(v = kappa, col = 2)
plot(rf$marginals.range.nominal[[1]], type = "l", xlab = "range nominal", ylab = "Density")
abline(v = sqrt(8)/kappa, col = 2)
Explore the posterior of the random field
str(idat <- inla.stack.index(stack, "est")$data)
int [1:1000] 1 2 3 4 5 6 7 8 9 10 ...
cor(coords.st$y, data.inla$summary.linear.predictor$mean[idat])
[1] 0.9999621
stepsize <- 4 * 1/111
# nxy <- round(c(diff(range(as.vector(coords.st[,'long']))),
# diff(range(as.vector(coords.st[,'lat']))))/stepsize) projgrid <-
# inla.mesh.projector(mesh,
# xlim=range(as.vector(coords.st[,'long'])),ylim=range(as.vector(coords.st[,'lat'])),
# dims=nxy)
coords.sp <- SpatialPolygons(list(Polygons(list(Polygon(cbind(x = c(0, 100, 100,
    0), y = c(0, 0, 100, 100)))), ID = "1")))
coords.sp <- spsample(coords.sp, n = 1000, type = "regular")
head(coords.sp)
SpatialPoints:
            x1        x2
[1,]  1.205305 0.1450983
[2,]  4.367583 0.1450983
[3,]  7.529861 0.1450983
[4,] 10.692138 0.1450983
[5,] 13.854416 0.1450983
[6,] 17.016694 0.1450983
Coordinate Reference System (CRS) arguments: NA
class(coords.sp)
[1] "SpatialPoints"
attr(,"package")
[1] "sp"
str(coords.sp)
Formal class 'SpatialPoints' [package "sp"] with 3 slots
  ..@ coords     : num [1:1024, 1:2] 1.21 4.37 7.53 10.69 13.85 ...
  .. ..- attr(*, "dimnames")=List of 2
  .. .. ..$ : NULL
  .. .. ..$ : chr [1:2] "x1" "x2"
  ..@ bbox       : num [1:2, 1:2] 1.205 0.145 99.236 98.176
  .. ..- attr(*, "dimnames")=List of 2
  .. .. ..$ : chr [1:2] "x1" "x2"
  .. .. ..$ : chr [1:2] "min" "max"
  ..@ proj4string:Formal class 'CRS' [package "sp"] with 1 slot
  .. .. ..@ projargs: chr NA
projgrid <- inla.mesh.projector(mesh, loc = as.matrix(as.data.frame(coords.sp)))
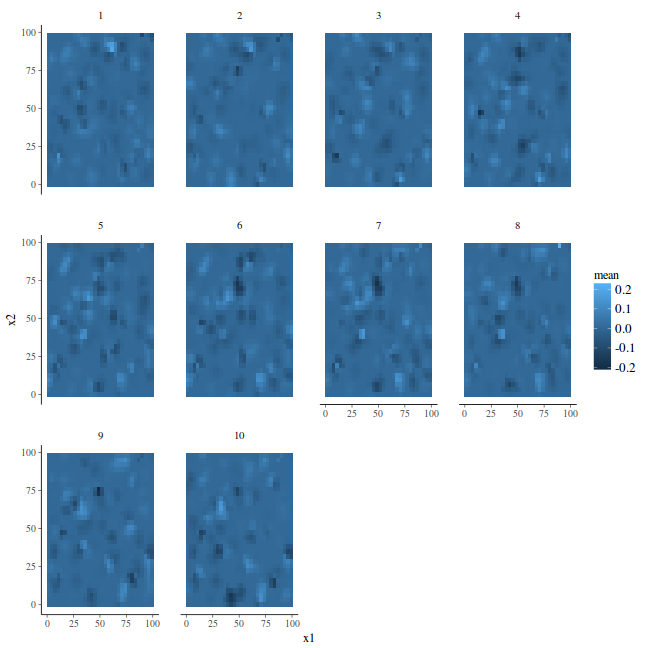
## The prediction for each time can be done by
xmean <- list()
newdata <- NULL

for (j in 1:k) newdata = rbind(newdata, data.frame(Year = j, coords.sp, mean = inla.mesh.project(projgrid,
    data.inla$summary.random$spatial.field$mean[s.index$spatial.field.group == j] +
        data.inla$summary.fixed$mean[1])))

head(newdata)
  Year        x1        x2        mean
1    1  1.205305 0.1450983 0.003424414
2    1  4.367583 0.1450983 0.003424594
3    1  7.529861 0.1450983 0.003424886
4    1 10.692138 0.1450983 0.003425941
5    1 13.854416 0.1450983 0.003428833
6    1 17.016694 0.1450983 0.003431504
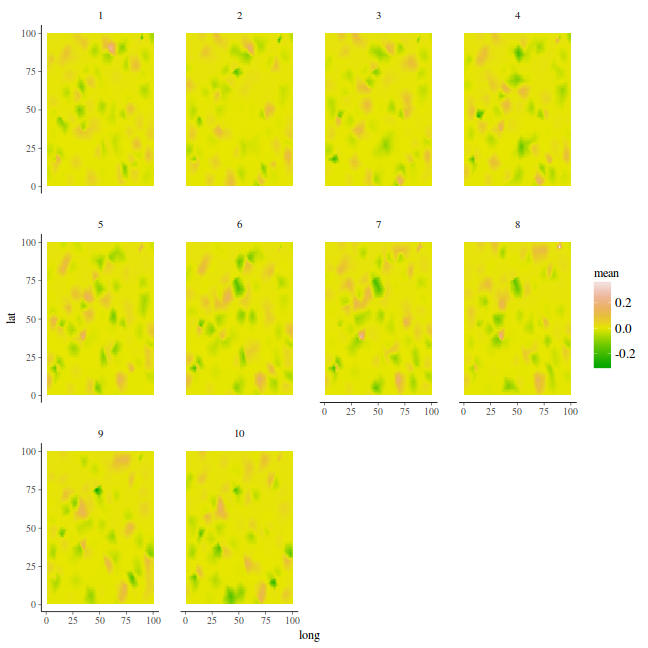
ggplot(newdata, aes(y = x2, x = x1)) + geom_tile(aes(fill = mean)) + facet_wrap(~Year)
stack.e <- inla.stack(data = list(y = coords.st$y), A = list(A, 1, 1, 1), effects = list(s.index,
    list(Intercept = rep(1, nrow(coords.st))), list(long = coords.st$long), list(lat = coords.st$lat)),
    tag = "est")

newdata = data.frame(long = rep(mesh$loc[, 1], k), lat = rep(mesh$loc[, 2], k), t = rep(1:k,
    each = mesh$n))

A.p = Diagonal(n = nrow(newdata))
stack.p = inla.stack(data = list(y = NA), A = list(A.p, 1, 1, 1), effects = list(s.index,
    list(Intercept = rep(1, nrow(newdata))), list(lon = newdata$long), list(lat = newdata$lat)),
    tag = "pred")
stack = inla.stack(stack.e, stack.p)
formula = y ~ 0 + Intercept + lat + long + f(spatial.field, model = spde, group = spatial.field.group,
    control.group = list(model = "ar1"))

data.inla <- inla(formula, data = inla.stack.data(stack), control.predictor = list(A = inla.stack.A(stack),
    compute = TRUE))
summary(data.inla)
Call:
c("inla(formula = formula, data = inla.stack.data(stack), control.predictor = list(A = inla.stack.A(stack), ",  "    compute = TRUE))")

Time used:
 Pre-processing    Running inla Post-processing           Total
         0.7510        422.8323          1.5971        425.1803

Fixed effects:
            mean     sd 0.025quant 0.5quant 0.975quant   mode kld
Intercept -8e-04 0.0113    -0.0230   -7e-04     0.0214 -7e-04   0
lat        1e-04 0.0001    -0.0002    1e-04     0.0004  1e-04   0
long       0e+00 0.0001    -0.0003    0e+00     0.0002  0e+00   0

Random effects:
Name	  Model
 spatial.field   SPDE2 model

Model hyperparameters:
                                              mean        sd 0.025quant
Precision for the Gaussian observations 39726.8987 2.456e+04 10712.2830
Theta1 for spatial.field                   -2.2313 8.455e-01    -4.0981
Theta2 for spatial.field                    1.5831 4.376e-01     0.8604
GroupRho for spatial.field                  0.6813 2.480e-02     0.6306
                                          0.5quant 0.975quant       mode
Precision for the Gaussian observations 33893.0710  1.034e+05 24397.2518
Theta1 for spatial.field                   -2.1352 -8.379e-01    -1.7642
Theta2 for spatial.field                    1.5335  2.550e+00     1.3420
GroupRho for spatial.field                  0.6819  7.280e-01     0.6831

Expected number of effective parameters(std dev): 980.00(11.91)
Number of equivalent replicates : 1.02

Marginal log-Likelihood:  1507.90
Posterior marginals for linear predictor and fitted values computed
p.index = inla.stack.index(stack, "pred")$data
data.mean = data.inla$summary.fitted.values$mean[p.index]

data = as.data.frame(coords.st)
coords.grid = expand.grid(long = seq(min(data$long), max(data$long), len = 100),
    lat = seq(min(data$lat), max(data$lat), len = 100))

data.inla.projector <- inla.mesh.projector(mesh, loc = as.matrix(coords.grid))


fit = sd = NULL

for (i in 1:k) {
    ii = (i - 1) * mesh$n + 1
    jj = i * mesh$n
    fit[[i]] = cbind(coords.grid, mean = c(inla.mesh.project(data.inla.projector,
        data.mean[ii:jj])), Year = i)
}

fit = do.call("rbind", fit) %>% filter(!is.na(mean))
fit %>% head
  long lat          mean Year
1    1   1 -0.0006711104    1
2    2   1 -0.0006708066    1
3    3   1 -0.0006715391    1
4    4   1 -0.0006722716    1
5    5   1 -0.0006730041    1
6    6   1 -0.0006723703    1
ggplot(fit, aes(y = lat, x = long)) + geom_tile(aes(fill = mean)) + facet_wrap(~Year) +
    # scale_fill_distiller(palette='BrBG', limits=c(0,4))
scale_fill_gradientn(colours = terrain.colors(10))
